|
|
|
TGVweb > TGV Research > Acoustic Imaging of TGVs |
Serve this page from: California, USA / Pisa, Italy |
Measurement of the sound produced by a TGV train (or any type of high speed train) passing at high speed is an important area of research and development. The power dissipated as noise goes up roughly with the cube of speed, with the result that high speed trains are rather louder than normal trains. Acoustic measurement techniques can pinpoint exactly where the noise is coming from. This has several important applications:
- Environmental Impact Evaluation. Data is used to develop governmental noise prediction schemes for evaluating noise emission levels along high speed rail lines.
- Sound Barrier Design. Source strengths can be used to evaluate the efficiency of sound barriers of various designs, which are intended to reduce the noise reaching surrounding inhabited areas.
- Train Design. Data identifies the principal sources of noise, where improved aerodynamic design or sound shielding might reduce the amount of sound radiated into the environment.
How is the Sound Measured?
The acoustic images were obtained with the SYNTACAN acoustic antenna array of the TNO Institute for Applied Physics (TNO-TPD) in Delft, The Netherlands.
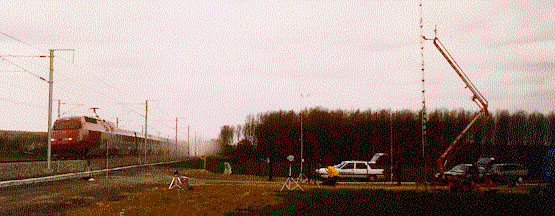
The SYNTACAN is designed for highly directional sound measurements. The complete system uses 36 microphones, forming a sparse array with a length of nearly 80 meters. In the vertical position 24 microphones are used and the height is 10 meters. In the picture, the SYNTACAN array is shown near a high speed line in Belgium, measuring the sound made by a Thalys trainset passing at 330 km/h, during a measurement campaign in 1996. The SYNTACAN boom is held at a slight angle from vertical by a crane, to correct for the cant of the track. A measurement van contains computer equipment to log the data. In the foreground, two other instruments are visible: a radar velocimeter, used to accurately measure the speed of the train, and an artifical noise source used to calibrate and align the acoustic antenna.
Using a two-dimensional Fourier analysis technique, the sound field is decomposed into the frequency dependent contributions from different directions, which can be associated with (partial) sound sources. The SYNTACAN system allows measurements in the 1/1 octave bands of 125 up to 2000 Hz with a resolution of 1/12 octave. (An octave is defined exactly the same way as in music, with 1/12 octave equal to one half tone; middle A is 440 Hz.) Its spatial resolution in radians approximately equals the ratio of wavelength to antenna length.
Acoustic Images of a TGV Atlantique
After being processed as described above, the data collected using the microphone array can be displayed as an image of the train as it would look if your eyes could "see" sound sources. The images don't look very much like a TGV Atlantique trainset, but if you observe closely, several interesting features can be picked out.
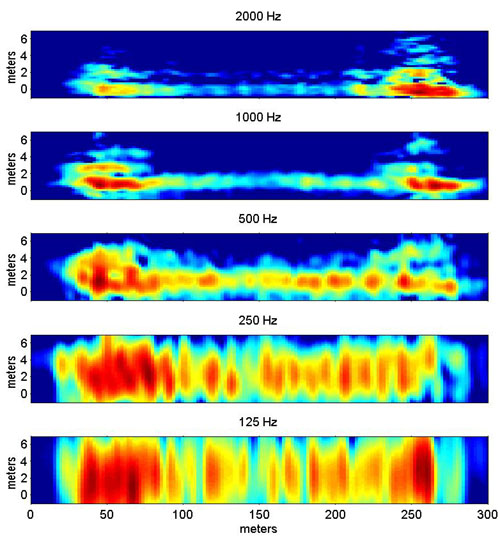
What you see is essentially several 2-dimensional side views of the train, taken in different octave bands. The center frequency of each picture is labelled above it. The images represent the measured sound pressure levels at the position of the antenna, as a function of height and lateral position along the train. Red is highest pressure (loudest), while dark blue is lowest. The images are different for the various octave bands, due to the varying importance and radiation characteristics of the noise sources and physical phenomena that generate the noise.
High-pitched rolling noise clearly emanates from the wheels; look at the picture in the 2000 Hz band. Most of the emission is concentrated at track level (0 meters on the vertical axis), and you can distincly see the individual bogies of the trailers. These show up as light blue spots at the center of the image, at a spacing of 18.7 meters (the length of a TGV trailer).
Aerodynamic noise sources are in general found all along the train. The power units (one at each end of the trainset) are clearly the loudest; this results in the red areas on the left and right sides of each image. You can also discern that the pantograph is raised on the right side power unit (at the rear of the train, which is travelling from right to left.)
Using this kind of data, it is possible to design quieter trains, better sound barriers, and to better estimate the noise impact of high speed lines.
Courtesy of Dr. A.C. Geerlings, TNO-TPD, geerlings@tpd.tno.nl. Full reference:
J.D. van der Toorn, H. Hendriks and T.C. van den Dool, Journal of Sound and Vibration, 193 (1) 1996, pp 113-121, "Measuring TGV source strength with Syntacan"
For more information, please visit the Acoustic Division at the TNO Institute of Applied Physics.Last modified: 7 September 1998
TGVweb > TGV Research > Acoustic Imaging of TGVs